
How to Read Your Design Firm’s Financial Statements

 4
4
Summary
Understanding your firm’s financial statements is essential to managing a successful design business. This guide breaks down the balance sheet, profit & loss (P&L) statement, and cash flow statement—explaining what each reveals about your assets, liabilities, income, and cash movement. These documents help you assess financial health, make informed business decisions, and prepare for growth or investment opportunities. Knowing how to interpret key metrics like solvency ratios and net income empowers you to confidently navigate your firm’s financial future.
Reflection Questions
How comfortable am I with interpreting financial documents, and what specific areas feel the most confusing or intimidating to me?
What financial patterns or insights could I uncover if I reviewed my firm’s balance sheet, P&L, and cash flow statement each quarter?
In what ways could tracking solvency ratios impact my ability to plan for growth, secure funding, or improve operations?
Journal Prompt
Think back to the last major business decision you made—whether it was hiring a team member, purchasing software, or adjusting service rates. Now imagine you had a solid grasp of your balance sheet, income statement, and cash flow at the time. How might your decision-making have changed? Reflect on how building financial fluency could transform the way you lead and grow your design firm.
At DesignDash, we understand that many firm owners have gaps in their business knowledge. Our goal is to take the anxiety, confusion, and awkwardness out of navigating the business of design. Through our blog posts, newsletters, workshops, and Community, we hope to fill in all those business management blanks left empty after your design school education. In this article, we’ll explain how to read your firm’s financial statements, including your balance sheets, profit and loss statements, and cash flow statements. By analyzing the information in these statements, you can gain insights into your firm’s assets, liabilities, revenue, expenses, and overall financial position. You can use these statements to formulate metrics like your liquidity ratio, net profit margin, and solvency ratios — all of which speak to the financial health of your firm. These metrics can also be used to assess your progress toward meeting key goals, identify areas for improvement, help you respond to trends, and so much more. From your balance sheet to your P&L, here’s how to read your firm’s financial statements.
How to Read Financial Statements: Balance Sheet, Profit & Loss Statement, & Cash Flow Statement
Let’s start with the basics. What are balance sheets, income statements, and cash flow statements? Which parts of your business do they record? What do they tell you about your firm’s performance? Let’s get into it.
What is a Balance Sheet?
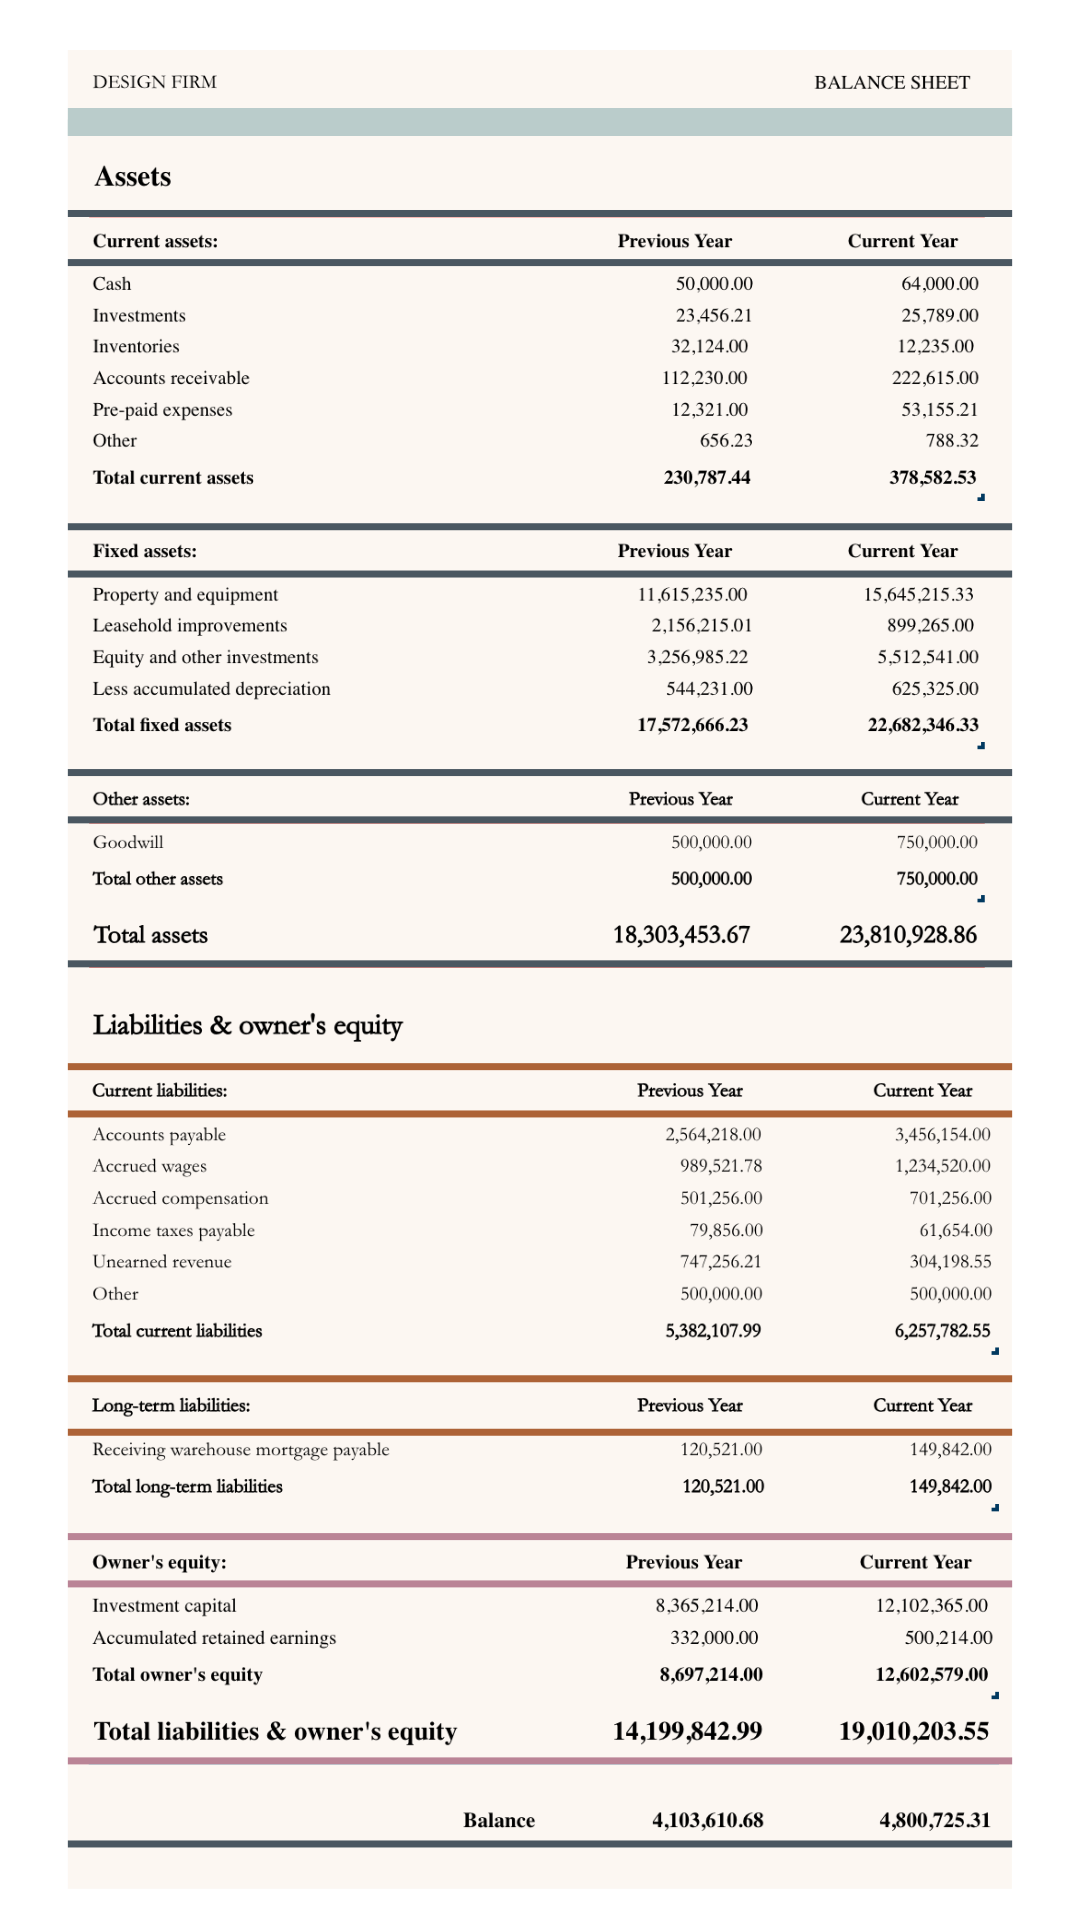
A balance sheet is a fundamental financial statement that provides a snapshot of a company’s financial health at a specific point in time. It gives you a clear picture of what your design firm owns (assets) minus what it owes (liabilities) or has sold (shareholder equity). Shareholder equity is the amount of money that would be given back to shareholders after deducting all debt owed and selling all assets if the firm was dissolved. Remember: Assets = Equity + Liabilities.
Assets are resources that have value and can be used to generate future economic benefits for the company. They include tangible items like cash, inventory, and property, as well as intangible assets such as patents or trademarks.
Liabilities represent claims against the company’s assets by creditors or other entities. Examples of liabilities include loans, taxes owed, accounts payable, and accrued expenses.
This information is crucial for understanding the overall health and performance of your business. For example, if your firm’s balance sheet shows more liabilities than assets, your firm might be struggling financially or relying heavily on borrowed funds. Analyzing your balance sheets helps you craft budgets, informs upcoming business decisions — like determining whether to hire, expand, or diversify — and provides prospective investors with important information about your firm.
To that latter point, investors and lenders often rely on this financial statement to gauge the financial soundness of a company before investing or providing financing. Understanding a company’s assets, liabilities, and equity allows investors to assess whether it is financially stable and capable of generating returns.
Current Assets
Current assets are resources or items that can be easily converted into cash within a short period of time, typically one year or less. Examples of current assets include cash, accounts receivable, inventory, and prepaid expenses.
Cash is perhaps the most straightforward example of a current asset. It represents money-saving that a business has on hand and can be readily used for various purposes such as paying bills or making purchases. Accounts receivable, on the other hand, is “future money.”
It refers to the money that a business expects to receive from its customers for goods or services rendered. This amount represents future revenue that will eventually generate income for the business.
Inventory is another important current asset that your firm might rely on if you have a retail or e-commerce component. It includes all the products or materials that a company holds for sale or use in production. Having a well-managed inventory ensures that businesses have enough stock to meet customer demand while avoiding excesses that tie up valuable capital.
Prepaid expenses are also considered current assets because they represent payments made in advance for goods or services that will benefit the business in the near future. For instance, if your firm pays for a one-year insurance policy upfront, it would classify as a prepaid expense until each month’s coverage is utilized.
Fuel your creative fire & be a part of a supportive community that values how you love to live.
subscribe to our newsletter
*please check your Spam folder for the latest DesignDash Magazine

Fixed Assets
Unlike current assets, fixed assets represent the long-term investments made by a company to support its operations and generate revenue. Current assets can be easily converted into cash within a year, but fixed assets have a longer lifespan and provide value over an extended period. On your balance sheet, you must record depreciation for each fixed asset.
A fixed asset can take various forms depending on the nature of the business. For example, if you own a design-build company, your fixed assets may include a fleet of vehicles, machinery, and equipment. If you own an interior design firm, your fixed assets might include your studio (if you own it), furniture in your office, and the computers used to complete projects. And if your firm includes a storefront, fixed assets would include the display cases and other permanent elements used to house or process inventory.
Fixed assets are not intended for immediate sale. Instead, they are used in day-to-day operations to produce goods or services. These assets play a vital role in generating revenue for the company over time.
Short-Term Liabilities
Liabilities, on the other hand, represent debts or obligations that a business owes to others. This can include loans, outstanding bills, or payments owed to suppliers. Liabilities can be divided into current liabilities and long-term liabilities. Current or short-term liabilities are those that are expected to be paid off within one year, such as short-term loans or accounts payable.
*Sales tax is reported on your balance sheet under short-term liabilities.
Long-Term Liabilities
Long-term liabilities may include items such as mortgage loans or bonds with longer repayment periods. These obligations extend beyond one year and require careful financial planning to ensure timely payments. It’s important for businesses to consider both short-term and long-term liabilities when evaluating their financial stability, and both will appear on your balance sheets. Current liabilities are listed first, with long-term liabilities to follow.
Fuel your creative fire, thrive with support from peers, & make 2025 your firm’s best year yet!
JOIN THE DESIGNDASH COMMUNITY

What is an Income Statement or Profit & Loss Statement?
A profit and loss statement, also known as an income statement, is another crucial tool for firm owners. It provides a detailed summary of your firm’s revenue, expenses, and overall profitability during a specific period of time.
The profit and loss statement essentially captures the difference between a company’s revenue and expenses over a given period. Revenue refers to the money generated from sales or services provided by the company. Expenses, on the other hand, encompass all the costs incurred in running the business, such as employee salaries, rent, utilities, and marketing expenses.
By subtracting the total expenses from the total revenue, we arrive at the net income or profit. A positive net income indicates that the company has made more money than it spent during the specified period, while a negative net income suggests losses were incurred. This information is invaluable for business owners as it allows them to make informed decisions regarding their operations and identify areas where they may need to adjust their strategies.
A profit and loss statement provides a comprehensive breakdown of the various components that contribute to a company’s financial position. It lists the revenues earned from different sources, allowing business owners to analyze which products or services are driving their profits. Additionally, it itemizes the different types of expenses, helping to pinpoint areas where cost-cutting measures may be necessary.
Learn more about how to read a P&L in our upcoming Summer Finance Series workshop. Sign up for the FREE workshop on 25 August at 12 PM CT here.
What is a Cash Flow Statement?
A cash flow statement helps you track the movement of money through your firm. It provides an overview of how much cash flows into and out of a company over a specific period of time — usually a month or a year —, where that cash goes, and where it comes from. A cash flow statement records sales revenue, expenses, investments, and savings. This statement includes three main sections: operating cash flow or activities, investing cash flow or activities, and financing cash flow or activities.
When analyzing a cash flow statement, it’s crucial to compare the actual cash flows with the corresponding numbers from previous periods. This will help identify trends and patterns in a company’s cash flow performance over time. Additionally, it’s important to consider external factors such as industry dynamics and economic conditions that may impact a company’s ability to generate cash.
Cash Flow from Operating Activities
Cash flow from operating activities encompasses all the cash that enters and exits your firm through day-to-day operations. This includes revenue from sales, payments made to suppliers, salaries paid to employees, and other expenses related to the core business activities. By analyzing this section, you can determine if your firm is able to generate enough cash from its operations to sustain its growth and pay off its debts.
Cash Flow from Investing Activities
Next, we have cash flow from investing activities. Cash flow from investing activities refers to the amount of cash that a business uses or generates through its investment-related transactions during a specific period. This section in the cash flow statement provides insights into how a company manages its financial resources and allocates them towards various investment opportunities.
Cash inflows may include proceeds from the sale of assets like land or buildings, dividends received from investments in other companies, or any gains realized from the disposal of long-term investments. Conversely, cash outflows could result from purchasing new equipment, acquiring additional shares in other companies, or buying fixed assets required for business operations.
Design Your Dream Firm in Just 5 Days
JOIN THE CHAOS TO CLARITY CHALLENGE!

Cash Flow from Financing Activities
Last, we have cash flow from financing activities. Cash flow from financing activities refers to the movement of cash in and out of a company’s financing activities, such as borrowing money or repaying loans.
When a firm borrows money from banks or other financial institutions, it increases cash generated from financing activities. This influx of cash provides the firm with additional funds that can be used for various purposes, such as investing in new projects, purchasing assets, establishing a relationship with a new vendor, or paying off existing debts. On the other hand, when a firm repays its loans or distributes dividends to shareholders, it decreases its cash flow from financing activities.
Analyzing cash flow from financing activities can provide valuable insights into a company’s ability to generate enough cash to meet its financial obligations. By tracking the inflow and outflow of cash related to financing activities, analysts and investors can assess whether a company has sufficient liquidity to cover its debt payments and other financial commitments.
In addition, analyzing cash flow from financing activities can help determine a company’s financial flexibility. If a company has a positive cash flow from financing activities, it means that it is able to attract investors or lenders who are willing to provide capital. This not only demonstrates the company’s strong financial position but also allows it to take advantage of investment opportunities and expand its operations.
It is worth noting that cash flow from financing activities should not be analyzed in isolation but rather in conjunction with other sections of the cash flow statement. By examining the entire cash flow statement, including operating activities and investing activities, analysts and investors can gain a comprehensive understanding of a company’s cash flow dynamics and financial performance.
Net Cash Flow
In the end, you have “net cash flow.” You can calculate net cash flow by subtracting total cash outflows from total cash inflows. A positive cash flow will demonstrate enough money to cover expenses and debt, while a negative cash flow will indicate insufficient funds.
To understand the importance of a cash flow statement, let’s say that you want to know if your firm is generating enough cash to cover its expenses and debts. By looking at the cash flow statement, you can see how much money is coming in from furniture sales and design fees and how much is going out towards inventory, rent, salaries, and loan repayments. This knowledge allows you to identify any potential issues early on and take appropriate measures to address them.
Calculating Your Firm’s Solvency Ratios
In the introduction to this post, we noted that accurately compiling and analyzing these financial statements can help you calculate ratios used by your team, lenders, and investors to better understand your firm’s financial health. These ratios — often grouped together as “solvency ratios” — offer clarity around whether it’s the right time to scale current operations, pursue financing, or shift towards a more effective revenue-generating business model.
As Adam Hayes writes in an article for Investopedia, “a solvency ratio is a comprehensive measure of solvency, as it measures a firm’s actual cash flow, rather than net income, by adding back depreciation and other non-cash expenses to assess a company’s capacity to stay afloat.” Unlike other metrics in this article, solvency ratios are projections of long-term financial health — not mere snapshots. Lenders will consider these metrics when determining whether to approve a loan application.
Common solvency ratios include your DTI, debt-service coverage ratio, debt-to-assets ratio, and debt-to-equity ratio. You will calculate DTI if using personal information to apply for a loan, line of credit, or other financing opportunity. The others reflect your business’ financial information. To calculate your Debt-to-Income ratio, add up all of your monthly bills and divide those obligations by your income before taxes are taken out.
Calculate your debt-service coverage ratio by subtracting expenses from revenue and dividing that figure by total annual debt service (which is interest on debt added to principal on debt). Debt-to-assets is total debt divided by total assets. Debt-to-equity is calculated by dividing total liabilities by total shareholder equity.

Related Posts

Parenting Teens While Running a Business
LIKE 0 LEAVE COMMENT 0 11 min read Summary Reflection Questions Journa

What is a Medical Insurance Superbill? How is it Used?
To all the women navigating the complexities of healthcare: remember t

Cultivating Company Culture: Firm Owners List Their Top Tips
Learn what design firm owners Laura Umansky, Bryan Yates, Lorna Gross,

How to Disguise TVs in Client Homes Without Compromising Style
From framed artwork screens to hidden cabinetry and mirror TVs, learn

Turning Setbacks into Opportunities: Transform Challenges into Success
Learn how to turn setbacks into opportunities with resilience and a gr

5 Podcast Episodes About Managing Your Interior Design Firm’s Finances
These five DesignDash episodes show how profit, billing, systems, and